Data Reporting
One important part of SDR is the way we gather and aggregate all recorded data from all our systems and finally compile simple reports. One major goal, when designing the reporting module, was to be able to get all these things in matter of minutes, saving your time in front of computer. You should be able to obtain the most needed information with minimal number of clicks, a different idea than say majority of current analytics packages.
SystemDataRecorder contains two main modules: the recording and the analytics or the reporting module. They can work independently of each-other, having the recording module alone or together coupled with the reporting module. In addition, if your recorded data comes from different collectors than SDR, you can feed the raw data into reporting module.
The reporting module, consists of several key technologies: a non-relational database system, Perl, R Statistical, PDQ analytical solver all running on top of a HTTP server. Additional tools help us to better visualize our workload(s), and measure them in order to conclude if we have the correct computer infrastructure. The reporting engine deploys simple scripts used to fetch, analyse and generate reports. This way, the SDR Reporting contains several sub-modules:

- Reporting Kernel
- Built on top of Perl, R, RRDtool and NGINX contains two main sub-modules: data input layer, responsible to handle all incoming data from all active hosts and data processin layer, managing all data analysis, plotting and reporting part. These two sub-modules can operate independently of each other. The kernel as well if offering a minimal API to export to the other consumers, via JSON, all aggregated data over HTTP or HTTPS.
- Data Visualization
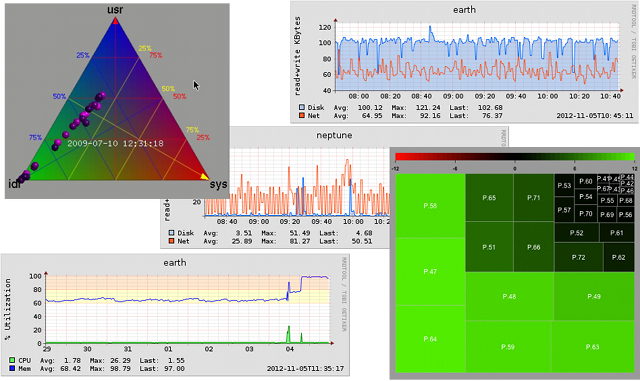
- Having access to raw data from the sdrd files means we can basically use any type of visualization software, we like. The SDR Reporting module supports three types of data visuallization engines: RRDtool, the default time series database, R for advances data analysis and plotting and cpuplayer, a simple and intuitive movie player of multiprocessor server configuration.
- Workload Management
- Additional to server, host utilization we are interested in finding out how well the applications are running. For this we collect throughput and service times from applications and we associate them to the host utilization.
- Forecasting
- To make projections about our computing infrastructure we associate computer system resources to queues. We solve these queues by a combination of algorithmic and numerical procedures. PDQ is our analytic solver, which is generally faster than a simulator and it simple to use. PDQ is open source software and available from PerfDynamics.

